Industry Lens
Industry Lens provides a macro view of what’s working across your entire industry. It helps you understand industry benchmarks, discover trends, and identify opportunities.
Workspace Structure
Industry Lens is organized into four main sections:- Insights — Executive command center with curated highlights
- Data — Industry-wide data landscapes
- Opportunities — Playbooks, whitespace, and efficiency opportunities
- Strategy — Full industry strategic report
Control Plane
The Industry Control Plane lets you select the time window for analysis: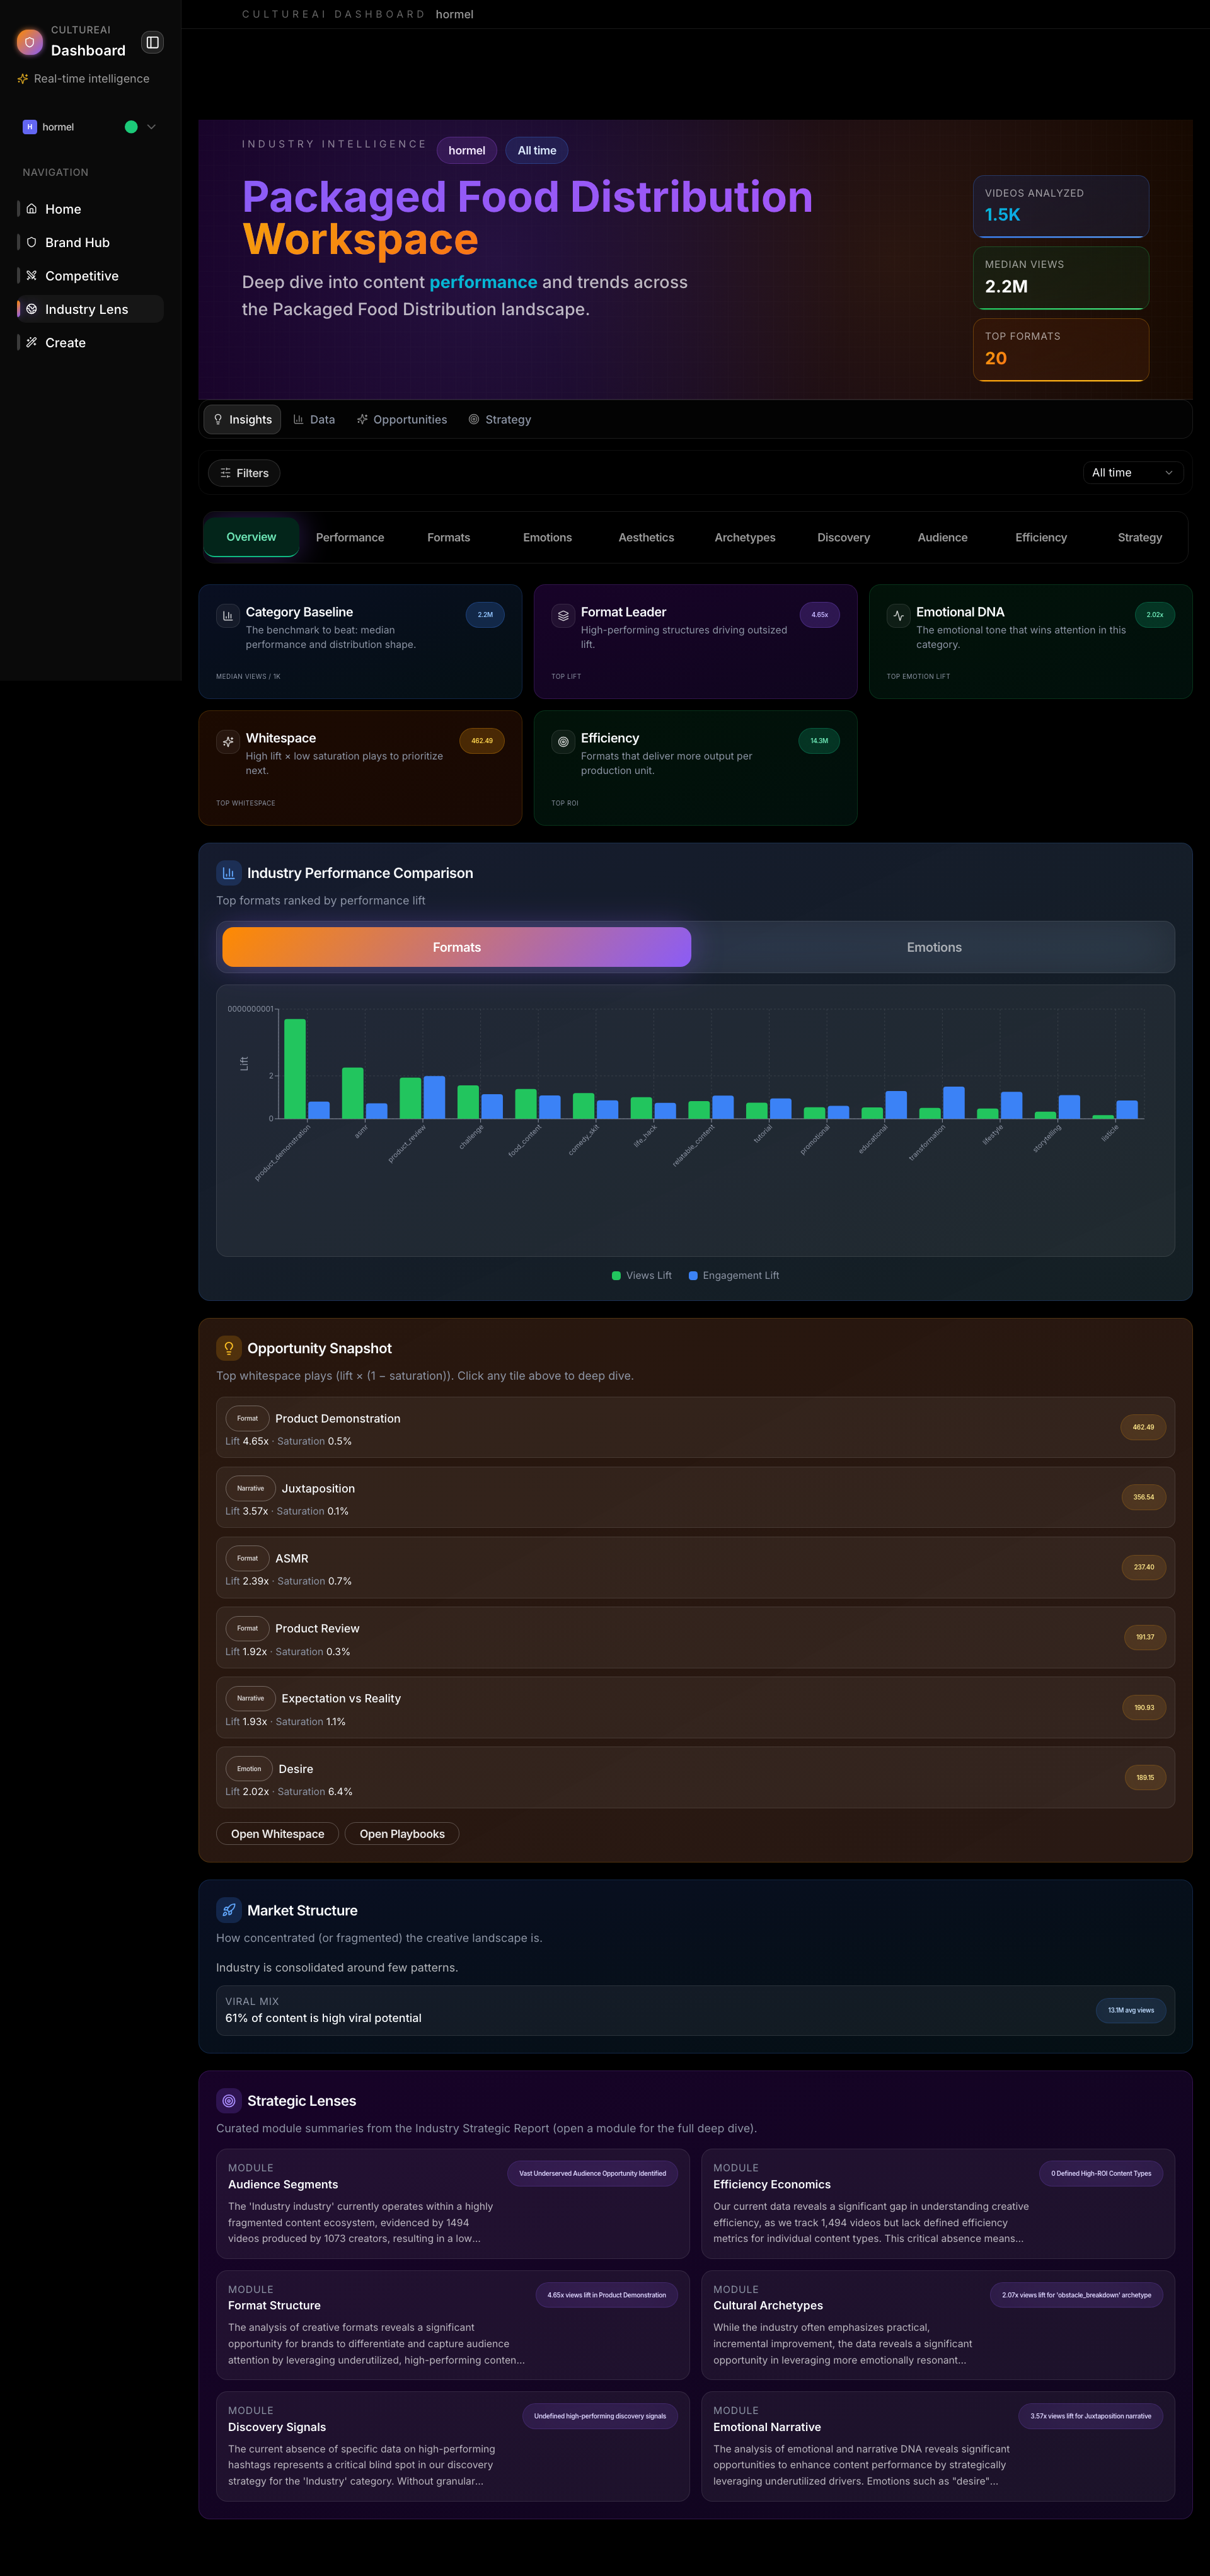
- All Time — Complete historical view
- Last 90 Days — Recent trends
- Last 30 Days — Current momentum
- Current Quarter — Quarterly view
Use shorter time windows to see current trends, longer windows for stable benchmarks.
Insights Section
The Insights section is your executive command center. It provides curated “at-a-glance” tiles with macro benchmarks. What you’ll see:- Industry baseline metrics
- Viral distribution patterns
- Fragmentation analysis
- Strategic highlights
- Baseline distribution (what good looks like)
- Viral potential distribution
- Industry fragmentation
- Benchmark heatmap
- Industry performance context
- Format and creative strategy
- Emotional and narrative DNA
- Visual and aesthetic codes
- Cultural and metaphoric archetypes
- Discovery and demand signals
- Audience segments
- Creative efficiency
- Strategic opportunity map
Data Section
The Data section provides detailed industry-wide analytics: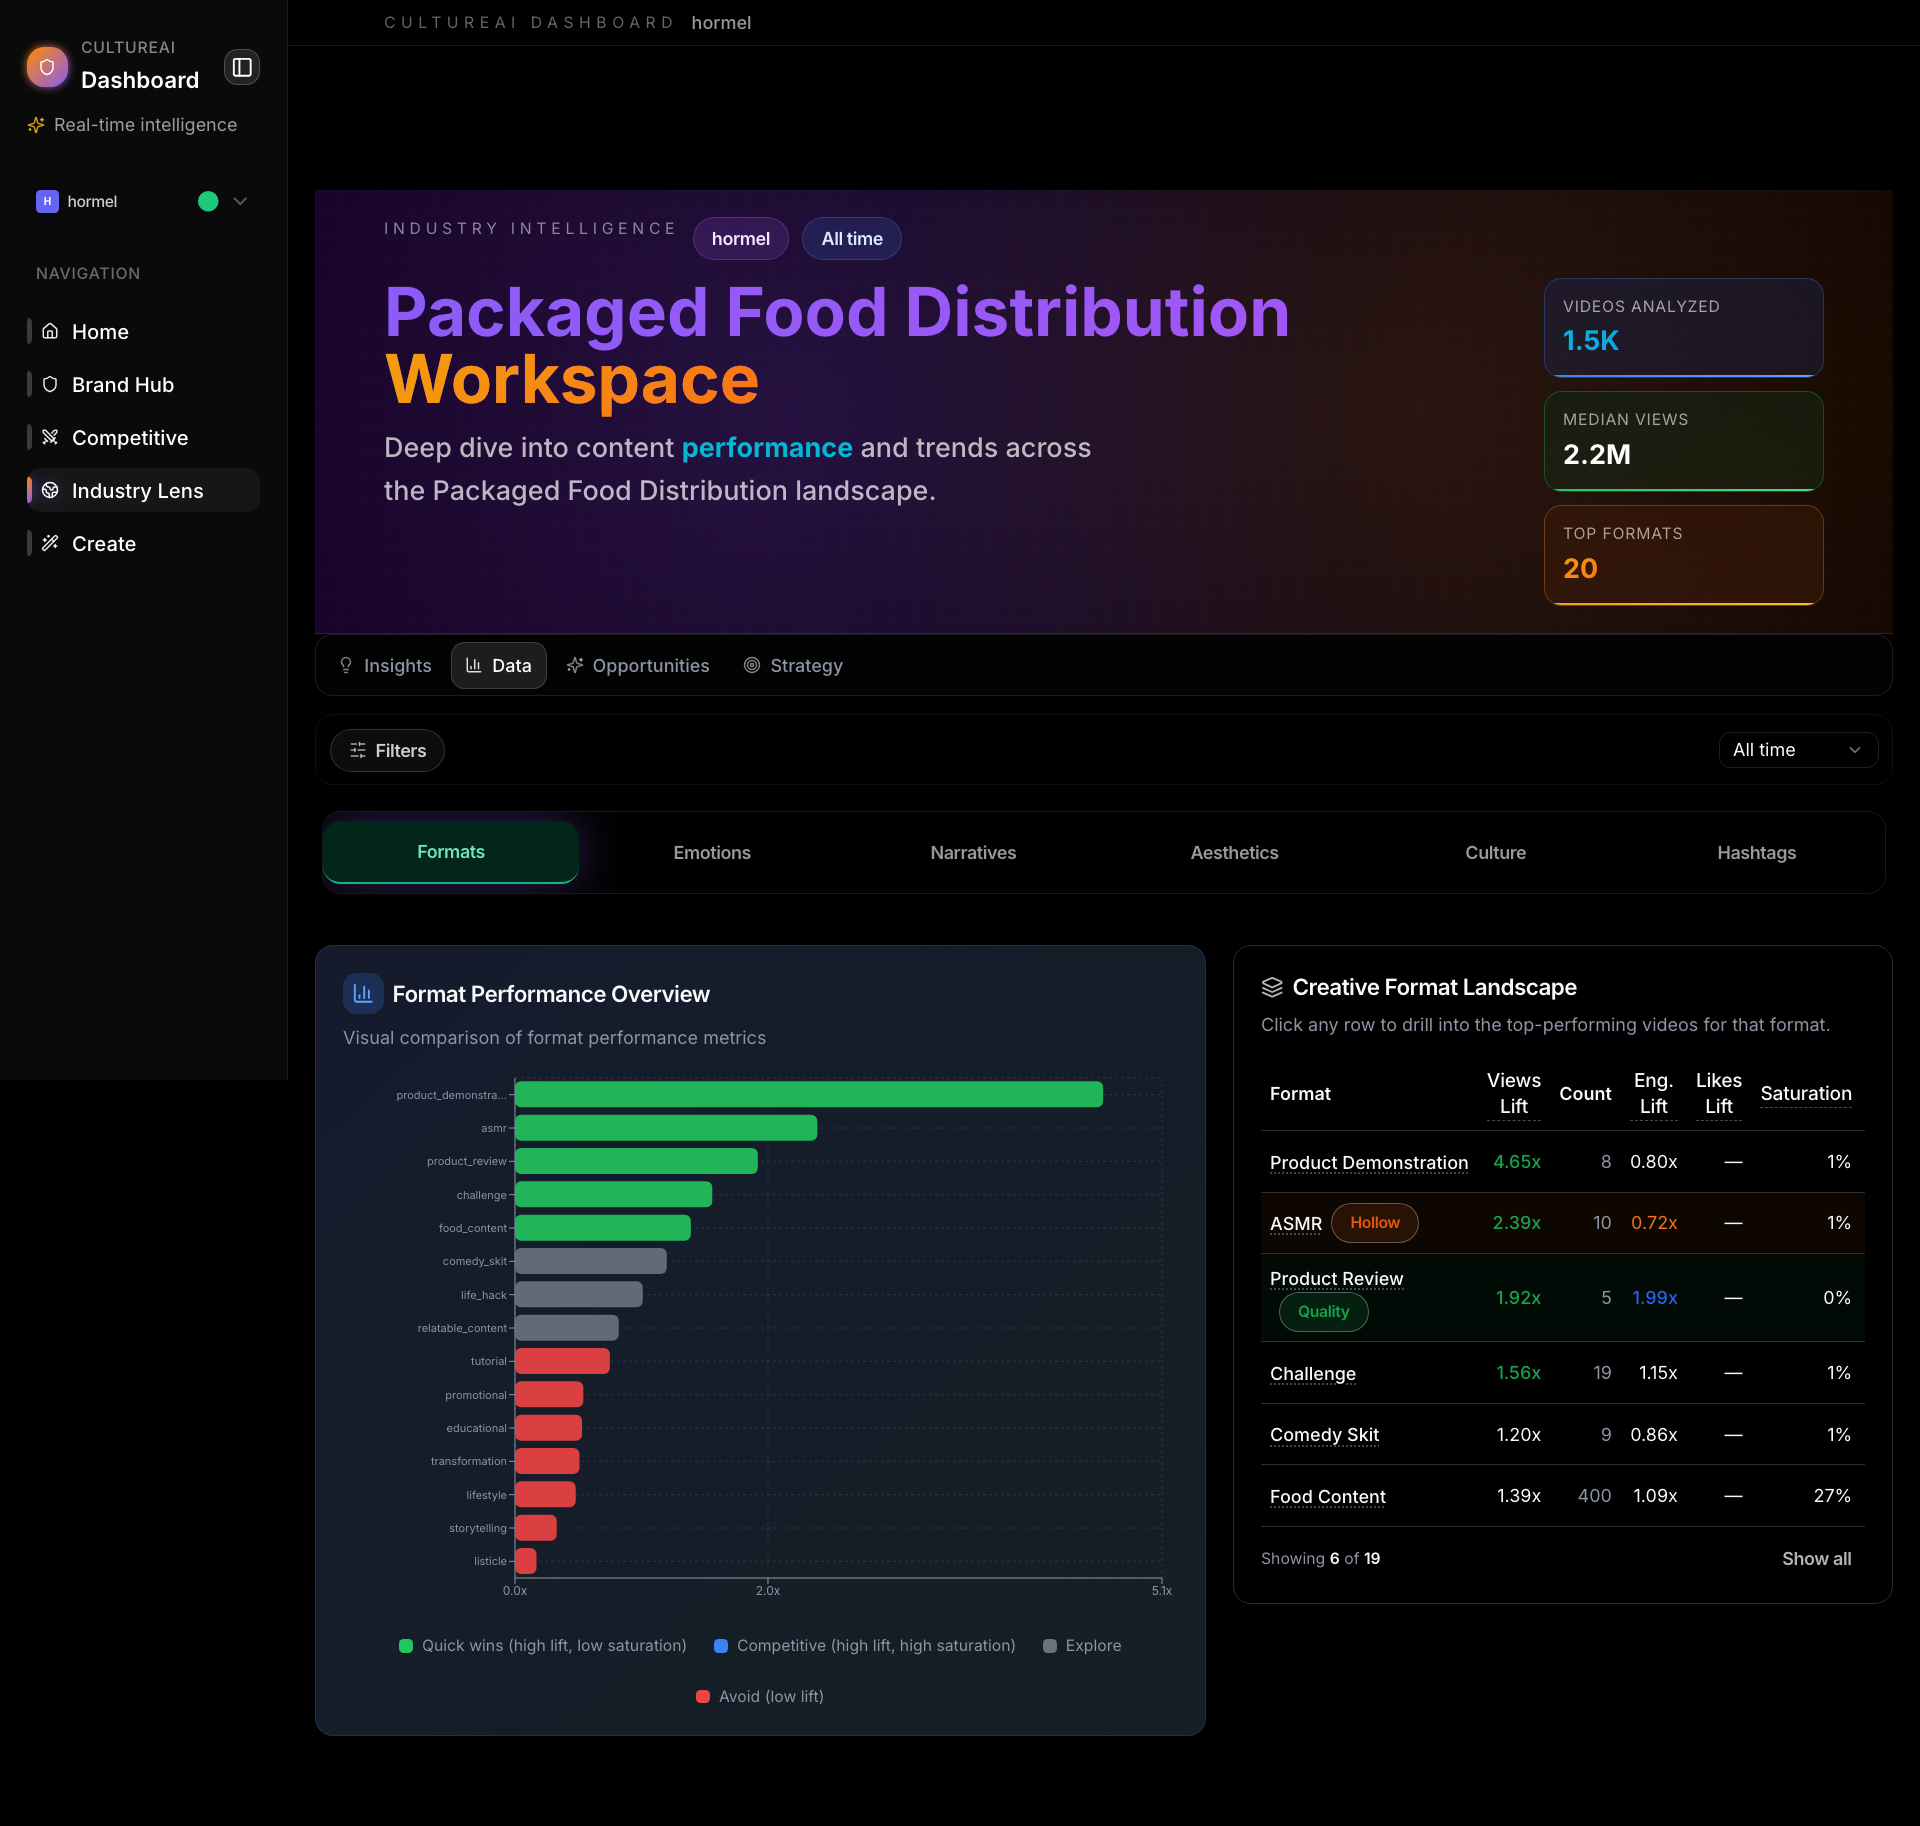
Formats Tab
What it shows: Industry format landscape Metrics:- Format lift (performance vs baseline)
- Format saturation (how crowded)
- Format velocity (trending up/down)
- Formats that perform well in your industry
- Underexploited format opportunities
- Format trends
Emotions Tab
What it shows: Emotional landscape of your industry Metrics:- Primary emotions that drive performance
- Secondary emotional layers
- Emotional lift scores
- Emotions that resonate in your industry
- Emotional whitespace
- Emotional trends
Narratives Tab
What it shows: Narrative arc performance in your industry Metrics:- Narrative structures that work
- Narrative lift and saturation
- Narrative velocity
- Narrative patterns that perform
- Narrative opportunities
- Story trends
Aesthetics Tab
What it shows: Visual style landscape Metrics:- Aesthetic archetypes that perform
- Aesthetic lift and saturation
- Visual style trends
- Visual styles that work in your industry
- Aesthetic opportunities
- Style trends
Culture Tab
What it shows: Cultural references and metaphoric archetypes Metrics:- Metaphoric types that perform
- Cultural reference usage
- Cultural lift scores
- Cultural patterns in your industry
- Metaphoric opportunities
- Cultural trends
Hashtags Tab
What it shows: Hashtag performance in your industry Metrics:- Top hashtags by lift and volume
- Hashtag performance summary
- Hashtag trends
- Hashtags that drive performance
- Hashtag opportunities
- Trending hashtags
Opportunities Section
The Opportunities section highlights industry-wide opportunities: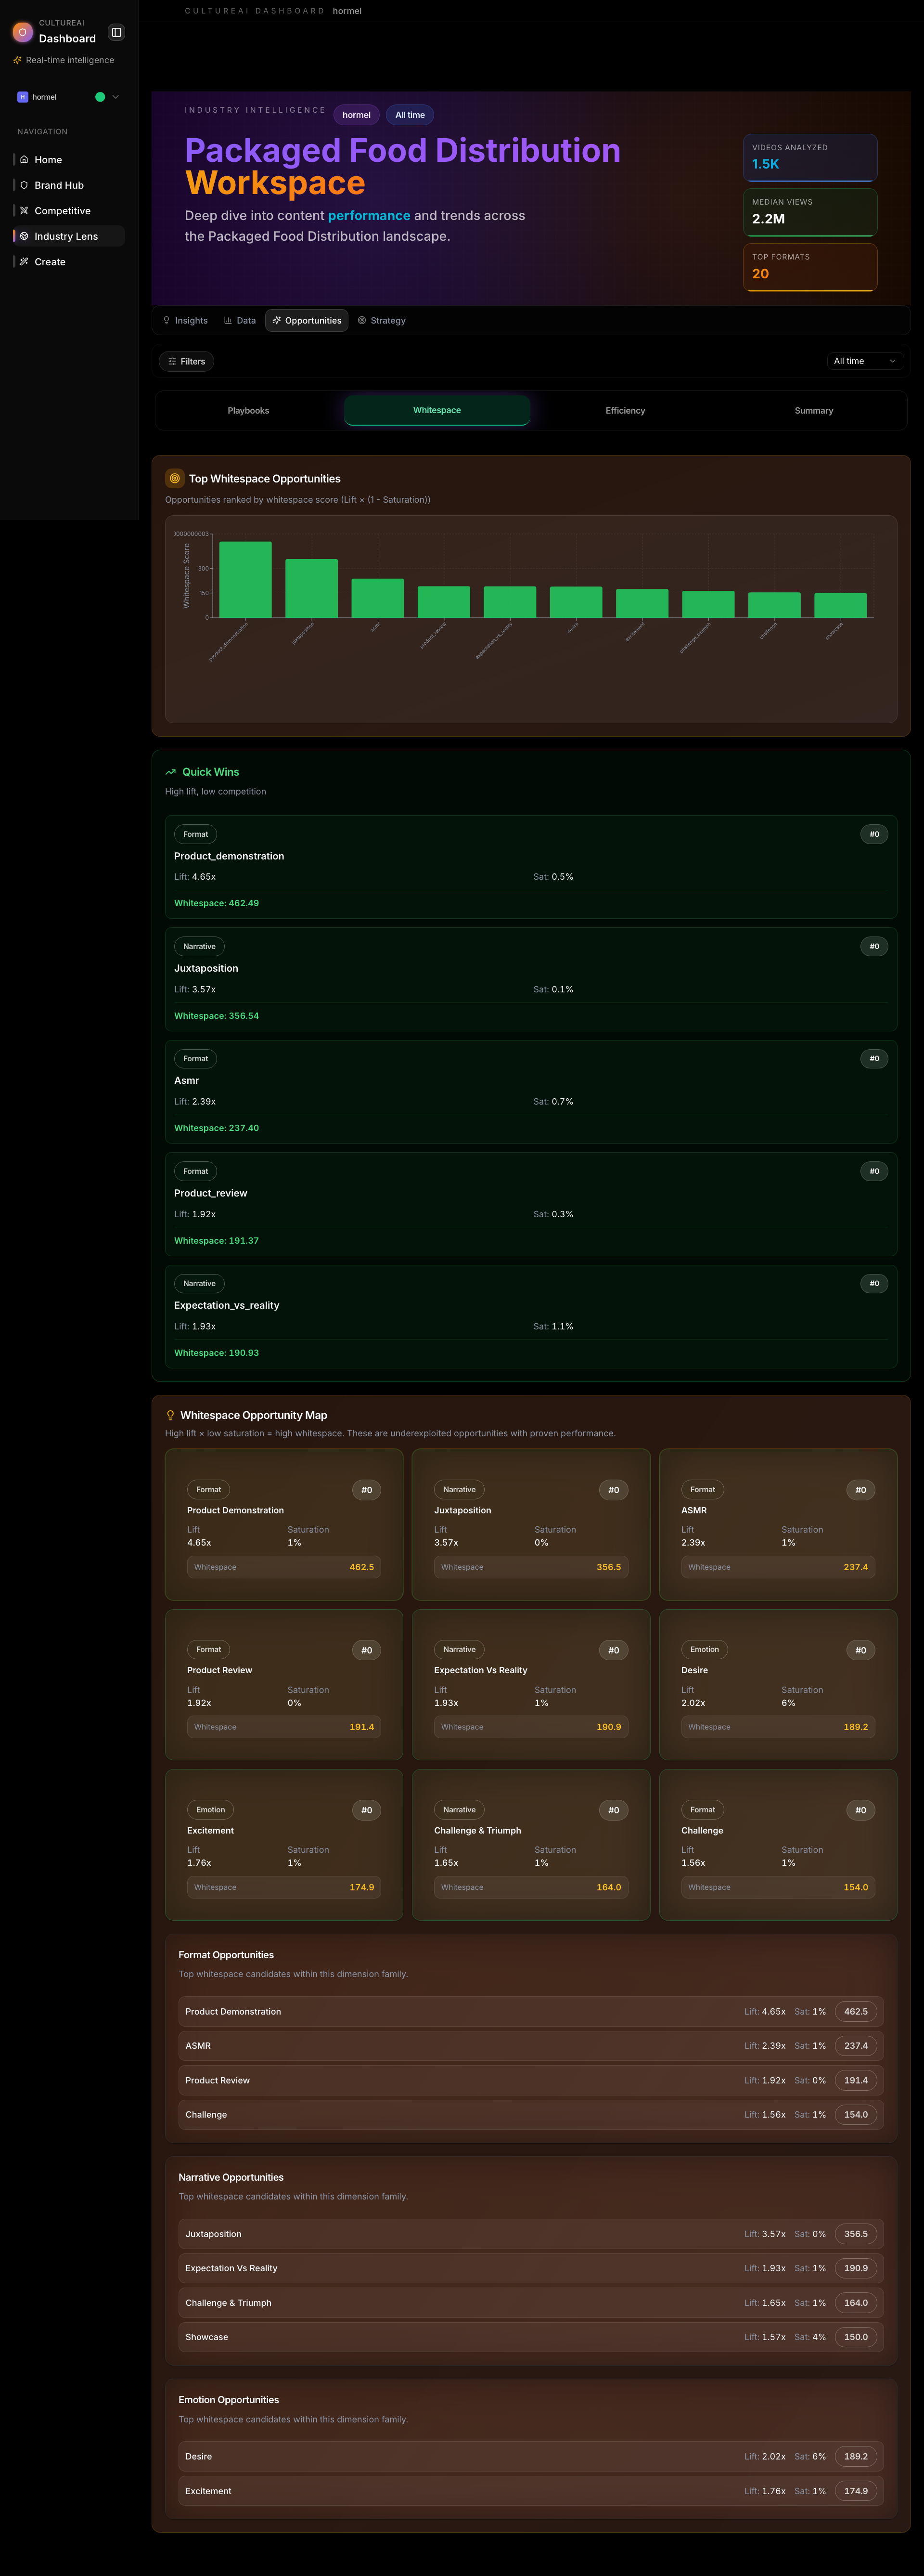
Playbooks Tab
What it shows: Strategic opportunity lanes What to look for:- Easy wins (low effort, high impact)
- Medium plays (moderate effort, good impact)
- Hard plays (high effort, high impact)
Whitespace Tab
What it shows: High-lift, low-saturation opportunities What to look for:- Underexploited content territories
- High-potential formats/emotions/narratives
- Quick wins
Efficiency Tab
What it shows: Production efficiency opportunities What to look for:- Formats with best ROI
- Production load vs performance
- Efficiency improvements
Summary Tab
What it shows: Strategic insights summary What to look for:- Key opportunities
- Fatigue warnings
- Strategic recommendations
Strategy Section
The Strategy section contains the full Industry Strategic Report — a comprehensive analysis of your industry landscape. What it includes:- Industry performance context and benchmarks
- Format and creative strategy intelligence
- Emotional and narrative territory analysis
- Visual and aesthetic codes
- Cultural and metaphoric archetypes
- Discovery and demand signals
- Audience segments and subcultures
- Creative efficiency and production economics
- Strategic opportunity map and priority plays
- Generate for industry-wide strategic planning
- Use to understand market dynamics
- Share for board presentations
Tips
- Use “Last 30 Days” for current trends, “All Time” for stable benchmarks
- Check the benchmark heatmap in Overview for quick visual insights
- Review playbooks to identify easy wins vs strategic plays
- Use whitespace opportunities to find underexploited territories